5.6. 2024-02-09 Performance study of conversion of OIF arrays to NumPy arrays via C extension
I have implemented a C extension to convert OIFArrayF64 * to NumPy arrays
not via np.ctypeslib but directly for efficiency.
These are the results of profiling:
Fri Feb  9 17:30:26 2024    profiler-results-oif-scipy_ode_dopri5

         3051649 function calls (3024692 primitive calls) in 6.099 seconds

   Ordered by: cumulative time
   List reduced from 5551 to 20 due to restriction <20>

   ncalls  tottime  percall  cumtime  percall filename:lineno(function)
    758/1    0.009    0.000    6.100    6.100 {built-in method builtins.exec}
        1    0.000    0.000    6.100    6.100 examples/compare_performance_ivp_burgers_eq.py:1(<module>)
        1    0.000    0.000    5.273    5.273 examples/compare_performance_ivp_burgers_eq.py:96(run_one_impl)
        1    0.003    0.003    5.273    5.273 examples/compare_performance_ivp_burgers_eq.py:194(_run_once)
     2000    0.005    0.000    4.856    0.002 oif/interfaces/python/oif/interfaces/ivp.py:38(integrate)
     2002    0.071    0.000    4.853    0.002 oif/lang_python/oif/core.py:146(call)
     2000    0.006    0.000    4.712    0.002 oif_impl/impl/ivp/scipy_ode_dopri5/dopri5.py:39(integrate)
     2000    0.004    0.000    4.706    0.002 <..>/lib/python3.12/site-packages/scipy/integrate/_ode.py:397(integrate)
     2000    0.351    0.000    4.701    0.002 <..>/lib/python3.12/site-packages/scipy/integrate/_ode.py:1173(run)
    89872    0.088    0.000    4.350    0.000 oif_impl/impl/ivp/scipy_ode_dopri5/dopri5.py:44(_rhs_fn_wrapper)
    89872    0.036    0.000    4.263    0.000 oif_impl/python/oif/callback.py:27(__call__)
    89872    0.413    0.000    4.227    0.000 {built-in method callback.call_c_fn_from_python}
    89872    0.410    0.000    3.813    0.000 oif/lang_python/oif/core.py:110(wrapper)
    89872    2.597    0.000    3.259    0.000 examples/compare_performance_ivp_burgers_eq.py:73(compute_rhs)
We can see from these results that the run time decreased in comparison
to the previous results (in the previous section), as in the wrapper
function conversion of OIF arrays to NumPy arrays is done in a more efficient
manner.
5.6.1. Native profiling
Native profiling results are
Fri Feb  9 17:49:50 2024    profiler-results-native-scipy_ode_dopri5

         2051233 function calls (2024295 primitive calls) in 4.467 seconds

   Ordered by: cumulative time
   List reduced from 5518 to 20 due to restriction <20>

   ncalls  tottime  percall  cumtime  percall filename:lineno(function)
    756/1    0.010    0.000    4.469    4.469 {built-in method builtins.exec}
        1    0.000    0.000    4.469    4.469 examples/compare_performance_ivp_burgers_eq.py:1(<module>)
        1    0.001    0.001    3.587    3.587 examples/compare_performance_ivp_burgers_eq.py:97(run_one_impl)
        1    0.004    0.004    3.586    3.586 examples/compare_performance_ivp_burgers_eq.py:195(_run_once)
     2000    0.004    0.000    3.185    0.002 <..>/lib/python3.12/site-packages/scipy/integrate/_ode.py:397(integrate)
     2000    0.305    0.000    3.181    0.002 <..>/lib/python3.12/site-packages/scipy/integrate/_ode.py:1173(run)
    89871    0.061    0.000    2.876    0.000 examples/compare_performance_ivp_burgers_eq.py:92(compute_rhs_native)
    89871    2.268    0.000    2.815    0.000 examples/compare_performance_ivp_burgers_eq.py:74(compute_rhs)
   849/11    0.005    0.000    1.026    0.093 <frozen importlib._bootstrap>:1349(_find_and_load)
   844/11    0.004    0.000    1.025    0.093 <frozen importlib._bootstrap>:1304(_find_and_load_unlocked)
   804/14    0.003    0.000    1.022    0.073 <frozen importlib._bootstrap>:911(_load_unlocked)
   683/12    0.002    0.000    1.022    0.085 <frozen importlib._bootstrap_external>:988(exec_module)
  2013/24    0.002    0.000    1.019    0.042 <frozen importlib._bootstrap>:480(_call_with_frames_removed)
   668/79    0.001    0.000    0.903    0.011 {built-in method builtins.__import__}
 1017/106    0.002    0.000    0.895    0.008 <frozen importlib._bootstrap>:1390(_handle_fromlist)
    89953    0.093    0.000    0.533    0.000 <..>/lib/python3.12/site-packages/numpy/core/fromnumeric.py:2692(max)
        1    0.000    0.000    0.482    0.482 <..>/lib/python3.12/site-packages/matplotlib/pyplot.py:1(<module>)
    90055    0.143    0.000    0.441    0.000 <..>/lib/python3.12/site-packages/numpy/core/fromnumeric.py:71(_wrapreduction)
1953/1833    0.027    0.000    0.433    0.000 {built-in method builtins.__build_class__}
      105    0.003    0.000    0.301    0.003 <..>/lib/python3.12/site-packages/matplotlib/artist.py:159(_update_set_signature_and_docstring)
5.6.2. Comparison for \(N = 1001\)
Comparing the run time for ode.integrate with native performance (results are
above), we see now the following profiling results:
OIF or native |
Run time, seconds |
|---|---|
oif |
4.706 |
native |
3.185 |
which gives 47% performance penalty for \(N = 1001\).
5.6.3. Comparison of normalized performance for different \(N\)
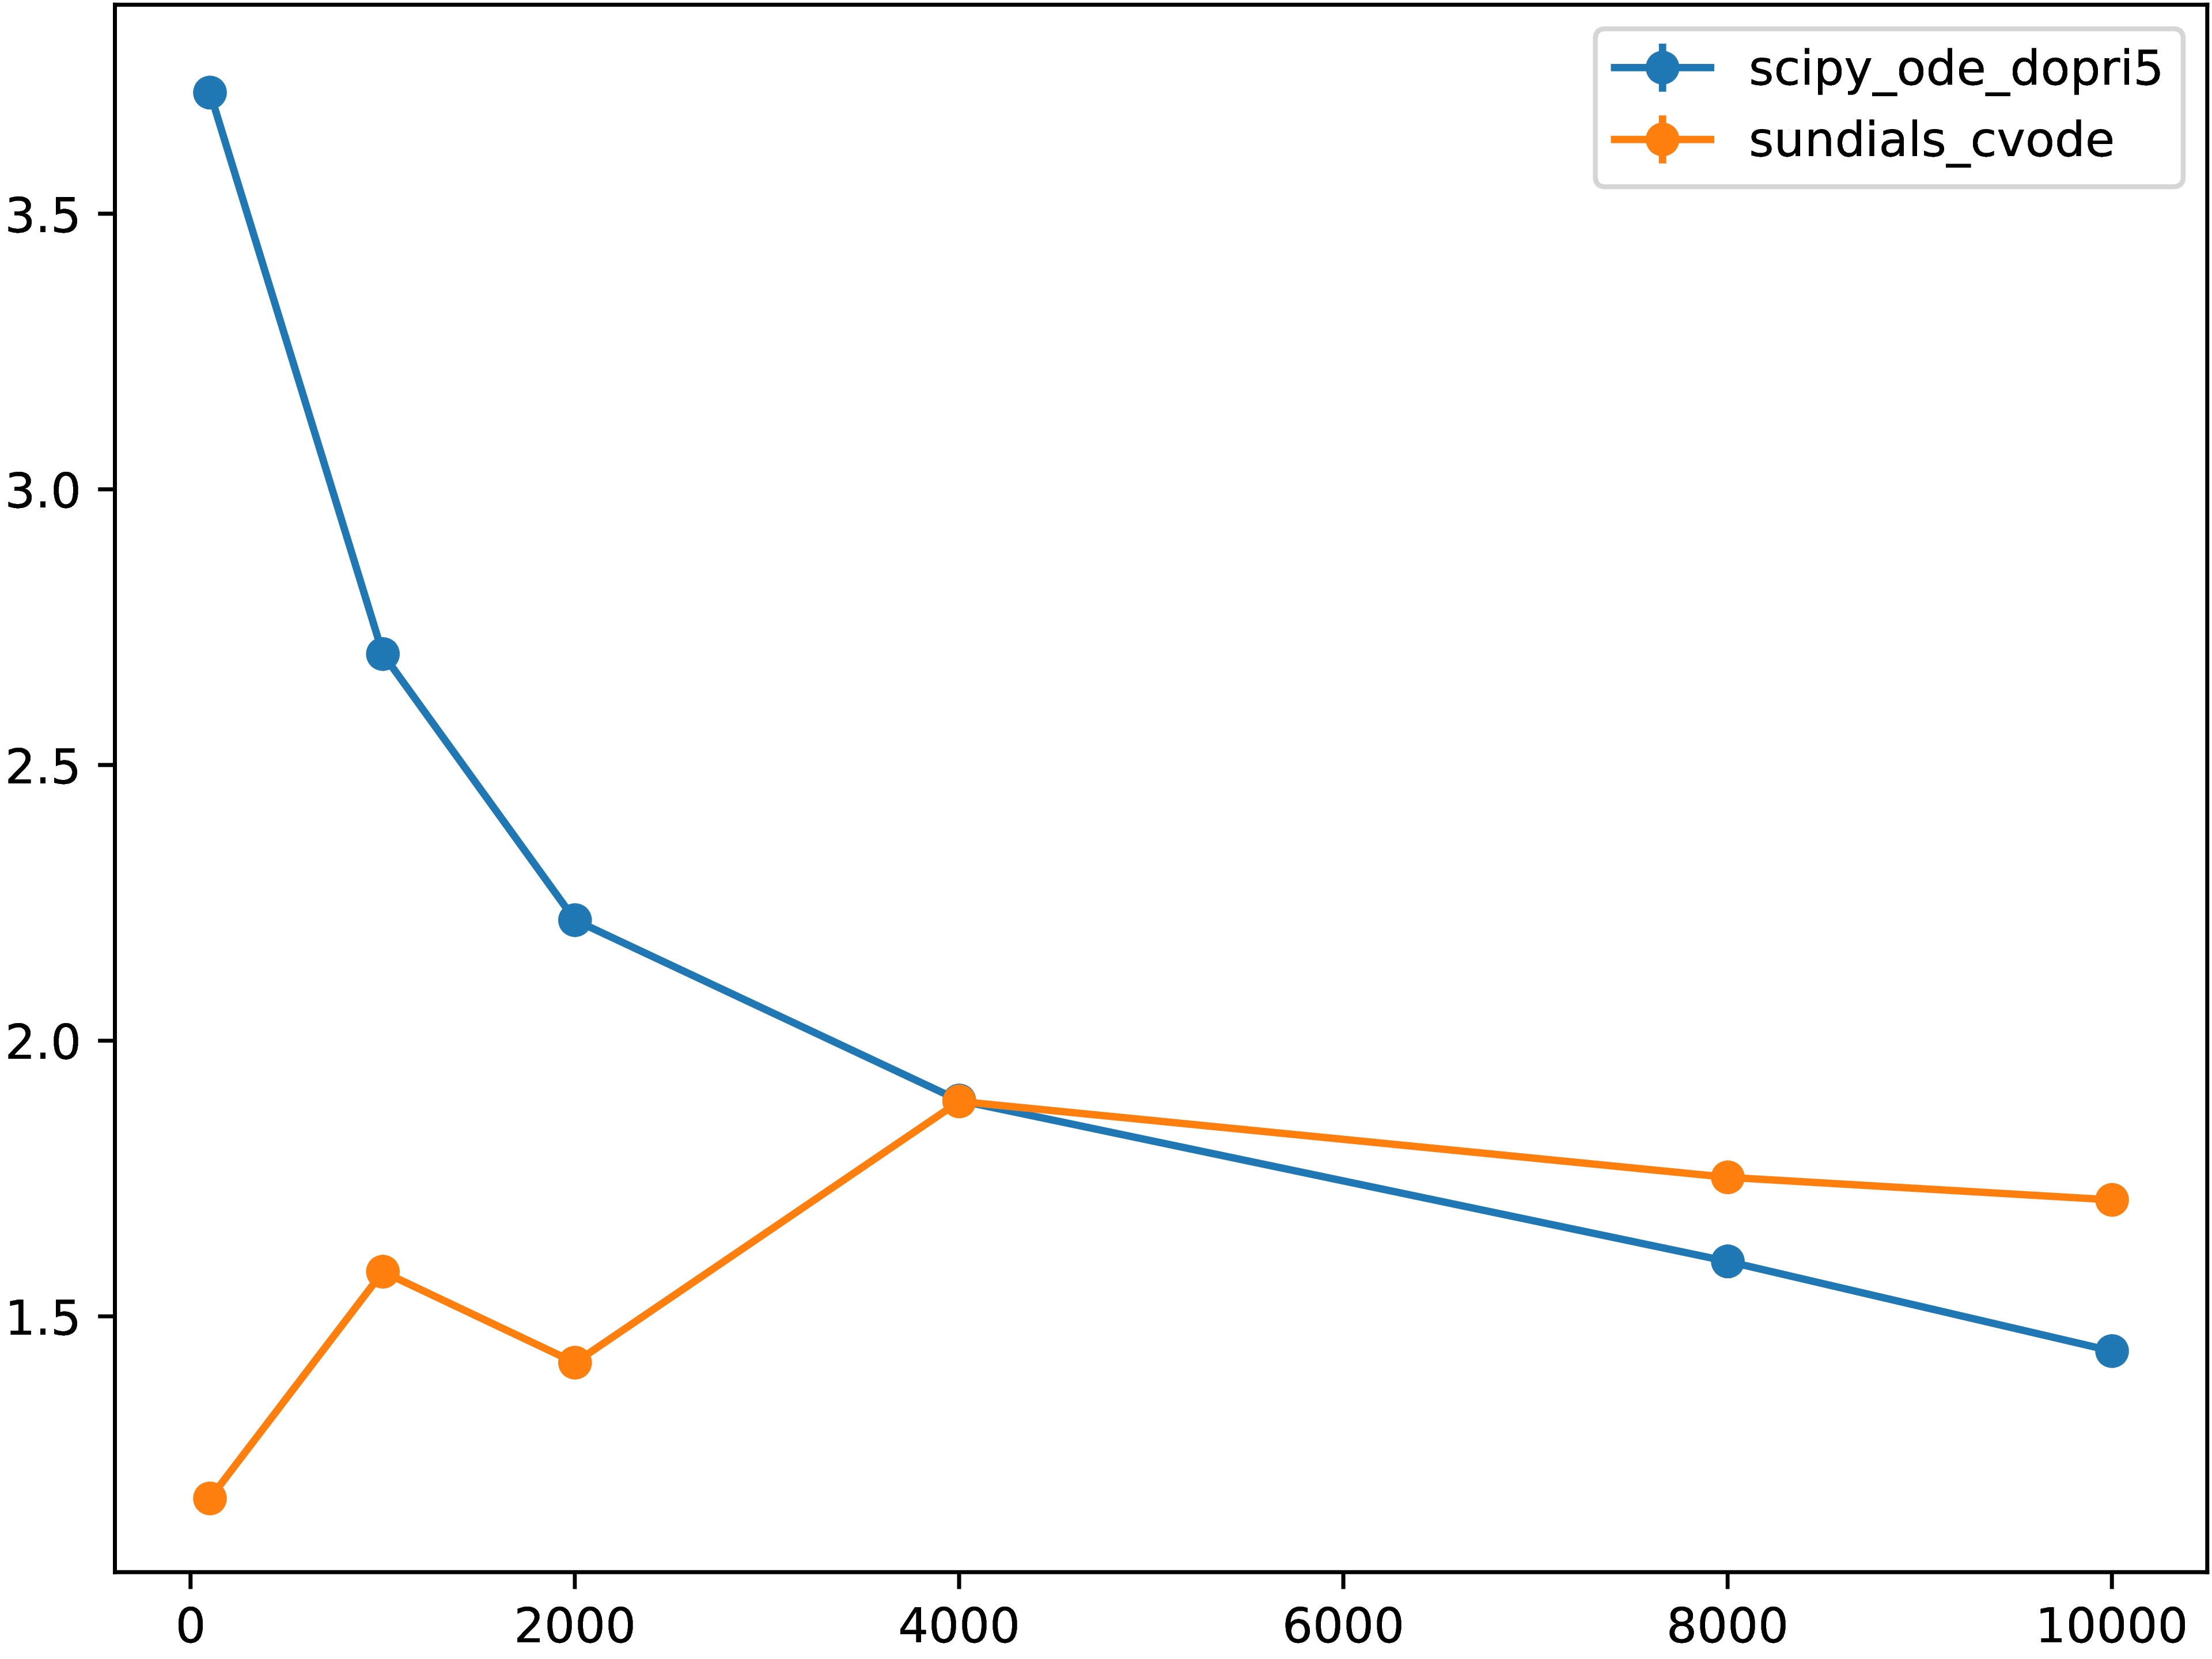
Fig. 5.6.1 Normalized runtime relative to the “native performance” of directly calling
scipy.integrate.ode.dopri5 from Python for different grid resolutions.
Values less than unity show are due to difference in numerical methods and
implementations.
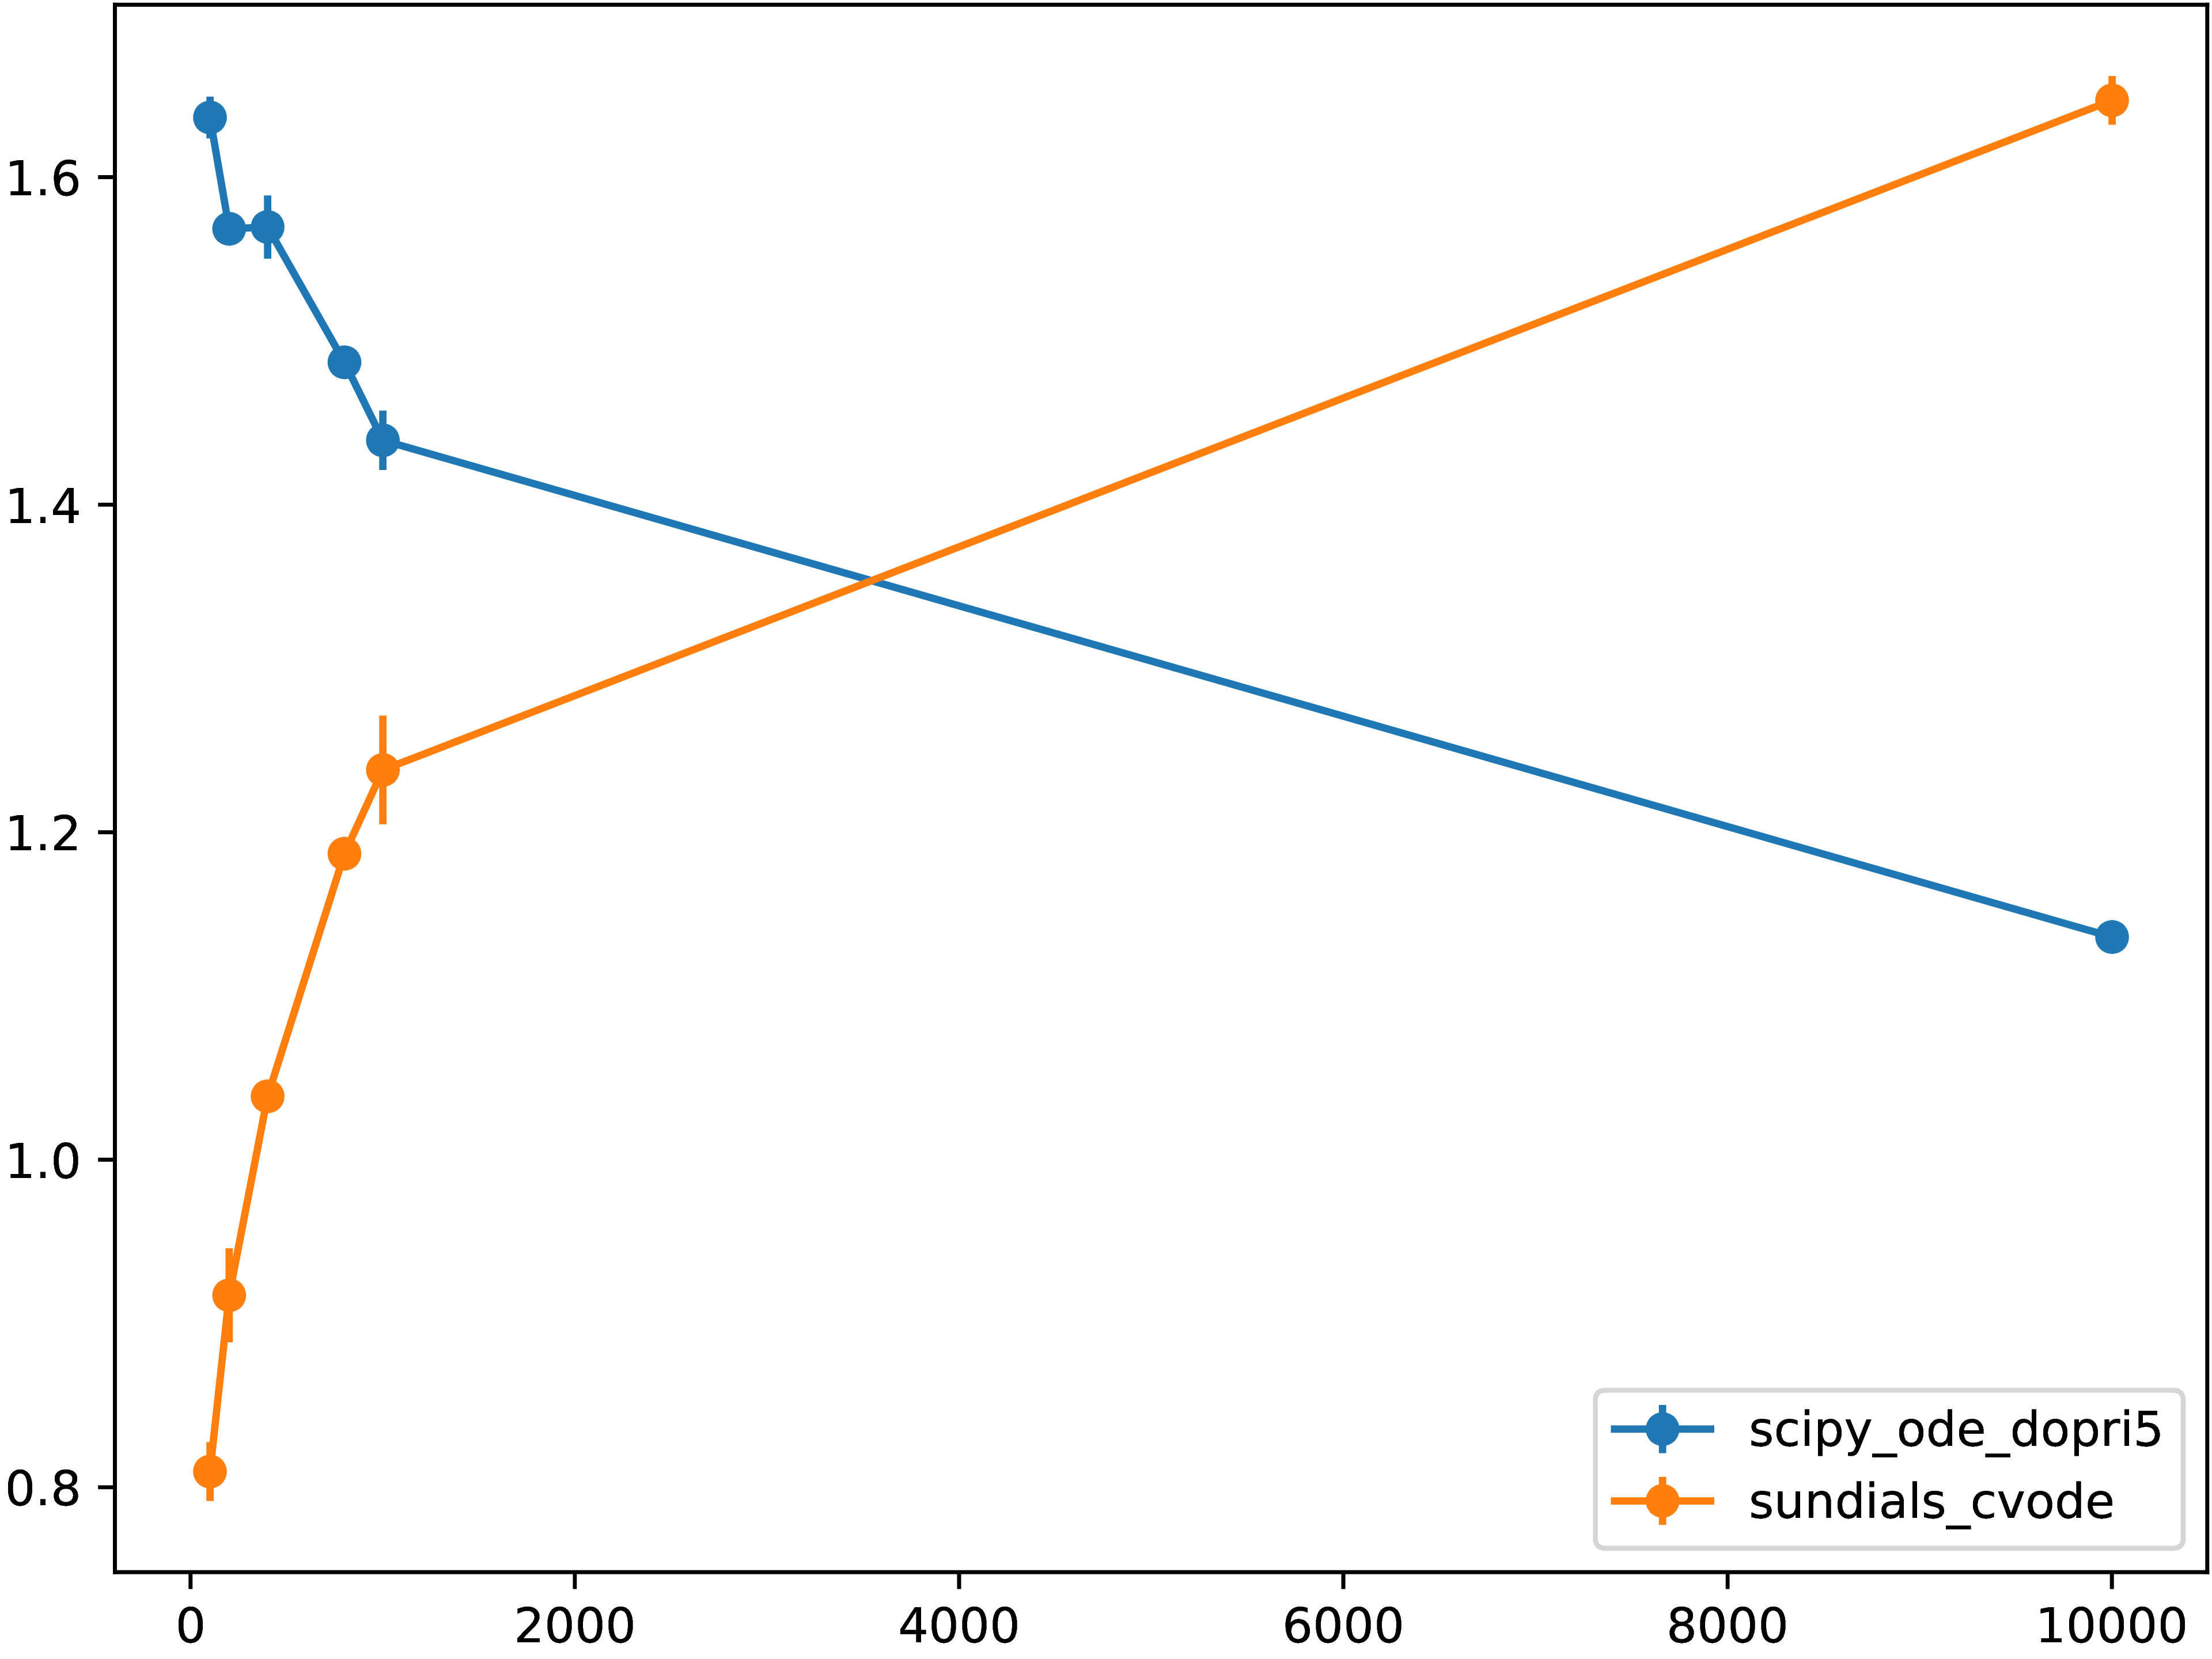
Fig. 5.6.2 Normalized runtime relative to the “native performance” of directly calling
scipy.integrate.ode.dopri5 from Python for different grid resolutions.
Values less than unity show are due to difference in numerical methods and
implementations.
We can see from these two figures that for resolution \(N = 10001\) where computational workload is relatively large, with the performance optimizations done here and in the previous section, performance penalty drops from 50% to 20%, that is more than twofold.