5.7. 2024-02-23 Performance analysis with Python wrapper for C callback (C extension)
This technical notes records the performance analysis done after the following code changes.
We implemented a Python wrapper for a C callback completely as a C extension.
Previously, it was done partially in Python as a class Callback that
implements __call__ and used conversion.call_c_func_from_python function
to do actual type conversion from Python to C and invoke a C callback.
Implementing this class completely as a C extension allows to allocated
memory for all required arguments once, in the initialization, instead
of doing memory allocations and deallocations in the above-mentioned
conversion.call_c_func_from_python function.
The required amount of memory for holding values as C types is completely
determined by the types: that is, we only need to know that, for example,
a C callback accepts OIF_F64 and OIF_ARRAY_F64, to allocate the memory
for these variables that is then used at each callback invocation.
IMPORTANT As before, the code is modified such that Python implementations still use C callback instead of Python callables.
5.7.1. Procedure
We analyze performance using command
python -m memray run -o memray-`dtiso8601`.bin \
    examples/compare_performance_ivp_burgers_eq.py \
    all --n_runs 3
where memray is a memory profiler.
5.7.2. Normalized performance results
Figure shows the normalized runtimes (with respect to the “native” results,
that is, direct invocation of scipy.integrate.ode objects).
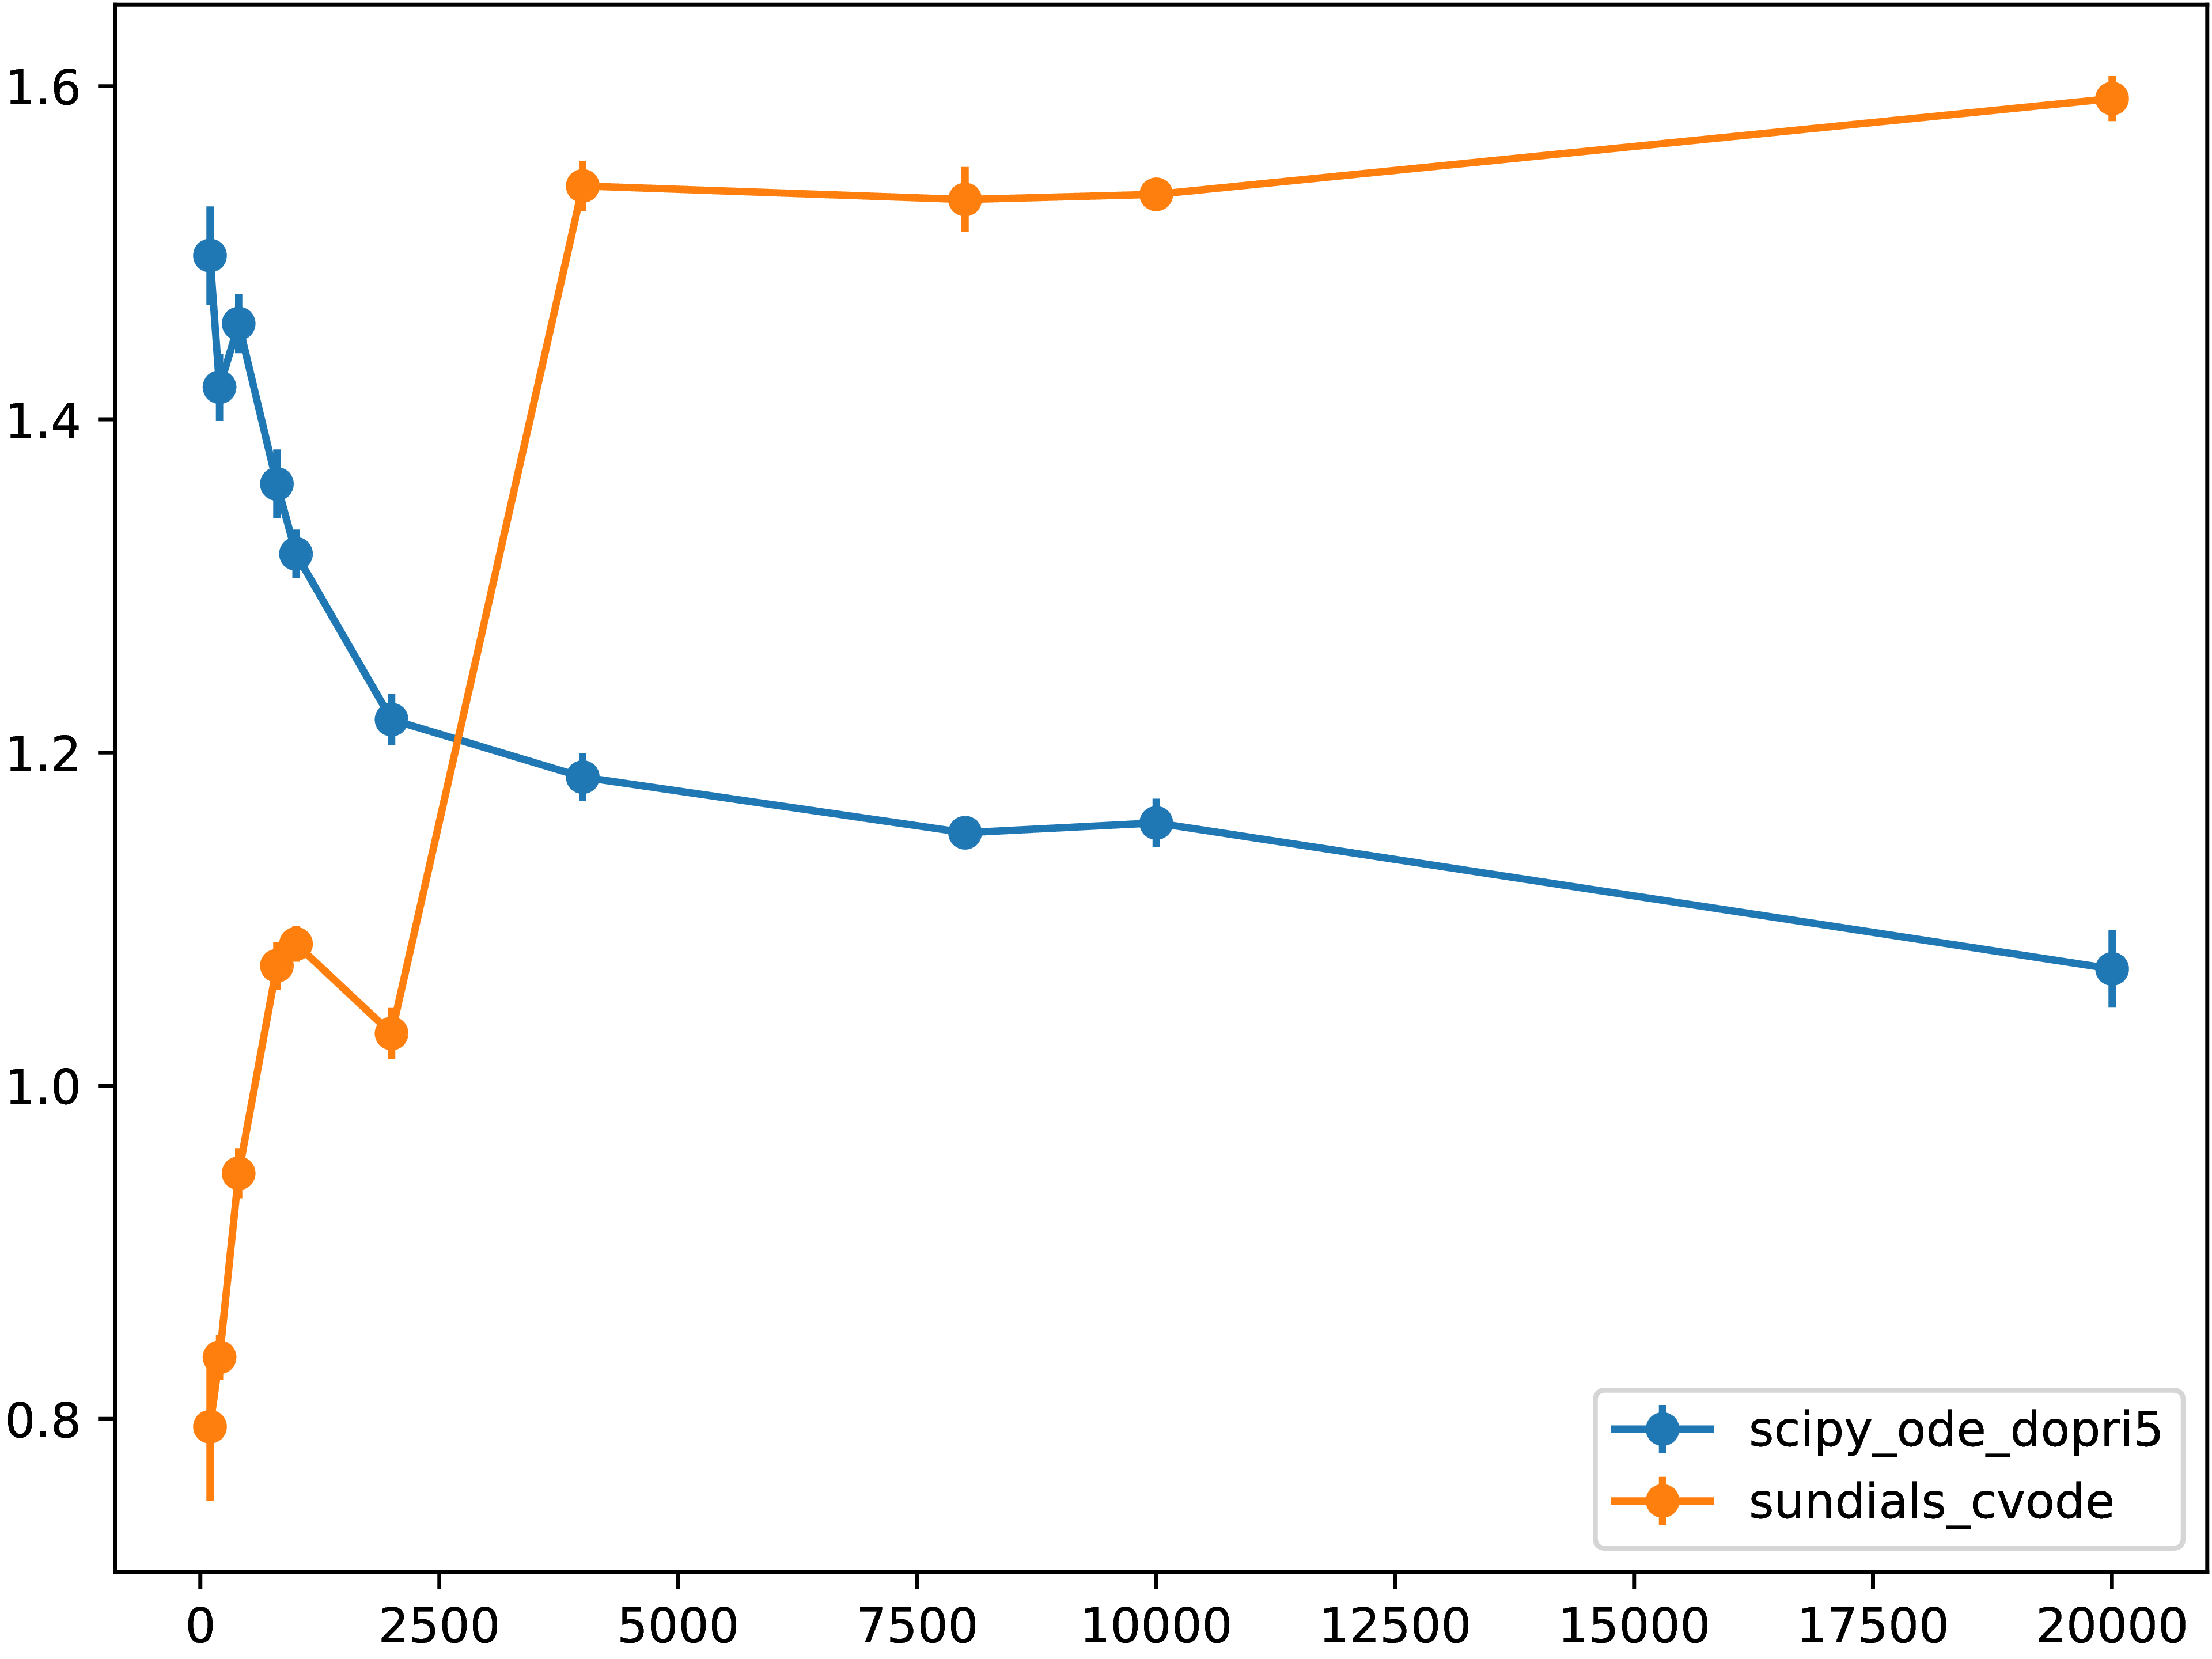
Fig. 5.7.1 Normalized runtime relative to the “native” code executation of directly
calling scipy.integrate.ode.dopri5 from Python
for different grid resolutions.
Values less than unity are due to the difference in numerical methods and
implementations.
5.7.3. Quantitative data
           N                  101               201               401               801              1001              2001              4001              8001              10001
        20001
scipy_ode_dopri5           0.84   0.02       1.54   0.02       2.61   0.04       4.40   0.07       5.32   0.07      10.68   0.05      25.21   0.23      65.20   0.42      96.45   1.13
    315.75   6.11
sundials_cvode             0.45   0.02       0.91   0.01       1.70   0.02       3.46   0.01       4.37   0.03       9.03   0.04      32.76   0.34      86.71   1.60     127.89   0.57
    469.90   1.90
native_scipy_ode_dopri5    0.56   0.01       1.08   0.01       1.79   0.01       3.23   0.05       4.03   0.03       8.76   0.13      21.27   0.23      56.60   0.36      83.31   0.72
    295.05   3.80
These are the performance penalty normalized data for scipy_ode_dopri5 versus
native call:
Resolution |
Normalized run time |
|---|---|
101 |
1,50 |
1001 |
1,32 |
10’001 |
1,16 |
20’001 |
1,07 |
5.7.4. Memory profiling
As I ran tests for runtime at different resolutions under the memray memory
profiler, I was able also to plot a memory usage plot to demonstrate that there
are no huge memory leaks (I am not sure that there no, but it least there are
no huge):
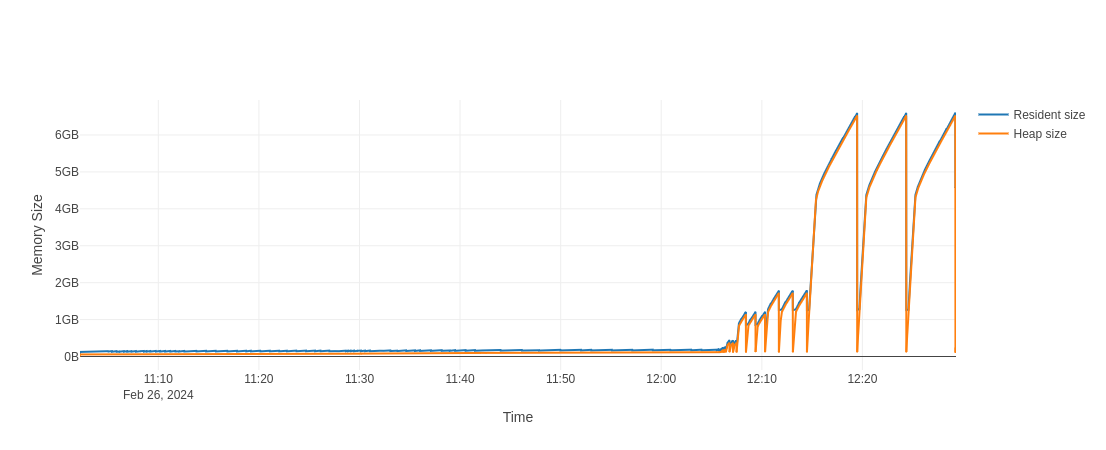
Fig. 5.7.2 Memory usage for the script compare_performance_burgers_eqn.py for different
resolutions. We can see that large resolutions like 10’001 and 20’001 points
required significant amount of memory but it seems that all the memory is
properly released, when a particular implementation is removed.